
How are you holding up? Are you still excited to learn more? But then again, having learned all this section will not make sense if you don’t apply it or put it into practice. So before you get carried away with the madness of daily trading, let us help you get started with the right platforms that will assist you as you analyze the stock of your choice.
There is a site called TradingView, which you could visit of course, after this session at www.tradingview.com. It is a social platform for traders and investors, both novice and expert, that aims to help them improve their investing skills in order to maximize profits. There are lots that you could pull up in just a span of a second, and it is perfect since you could also discuss your trading ideas with others. This is a completely free website unless you want to have additional perks, which so you don’t have to worry about how much you should shell out of your pocket while learning.
First is, of course, to create an account, then log in. Once you have logged in, go to the charts and you’ll see something like this. I have labeled the menus with different-colored arrows for easier reference as we go through.
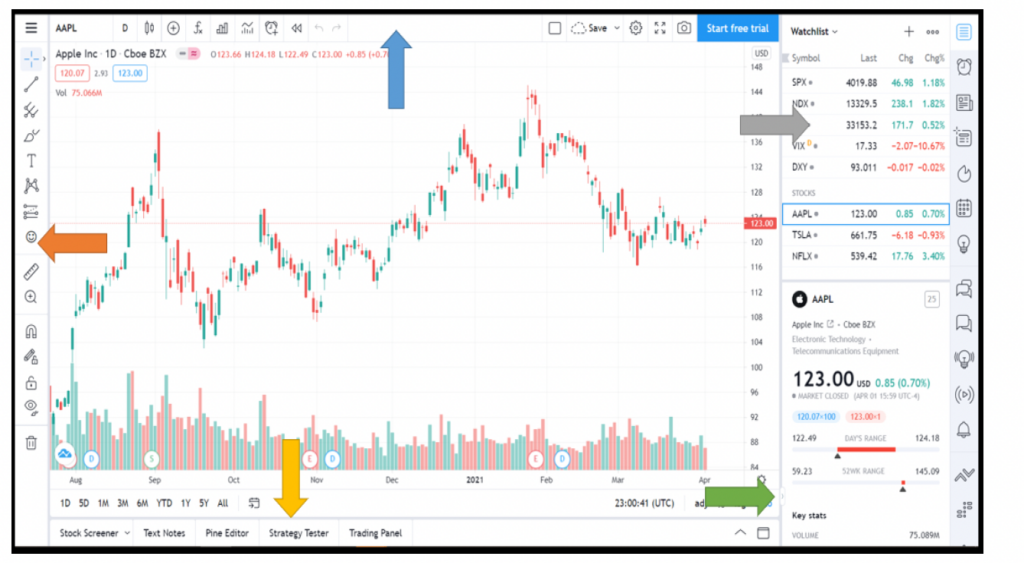
The blue arrow is the top menu, which you could use in finding the stock symbol you want to search, the intraday trading timeframe, and indicators. What you input in this menu will show up on the chart area on the middle part of the platform.
The orange arrow which is on the left side of the menu contains all the drawing tools you will need in doing your technical analysis. Each of the drawing tools has a dropdown that helps traders look for the tool that would cater to their needs in their analysis.
The gray arrow on the upper right side of the menu contains the watchlist which you could later customize. This will help you look out for the price action of a certain stock, and also update you on other commodities that might fit your trading criteria.
The green arrow on the lower right side of the menu contains the stock symbol that you have searched for in the blue menu, it’s general information like which sector did it belong to, the stock prices upon opening and closing, 52-week high price range, volume, and the stock price percentage change.
The yellow arrow on the bottom part indicates the further analysis of the stock. You could use this if you would consider the fundamental analysis of the stock even if day trading highly relies on technical analysis. However, the sky is the limit when it comes to analysis, and if you think it fits you that you also check the stock’s fundamentals, it is okay as well.
Now, let us try navigating through the basics of TradingView. What you should be able to do would be to search a stock, and insert your chosen indicators. I will still guide you so you would not get lost.
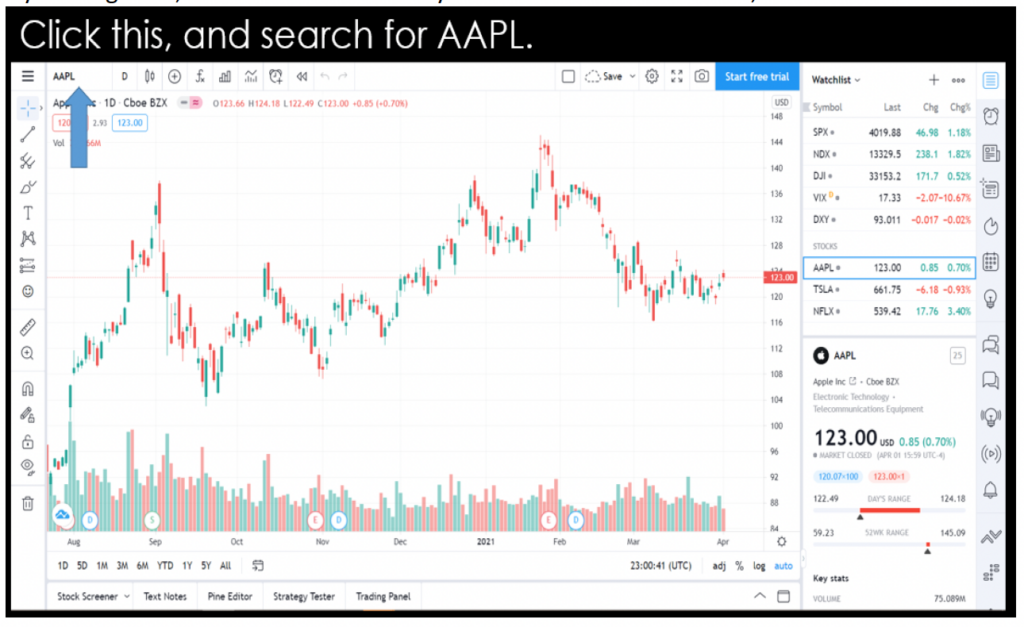
By clicking here, search for the stock of your choice. For this exercise, I chose AAPL.
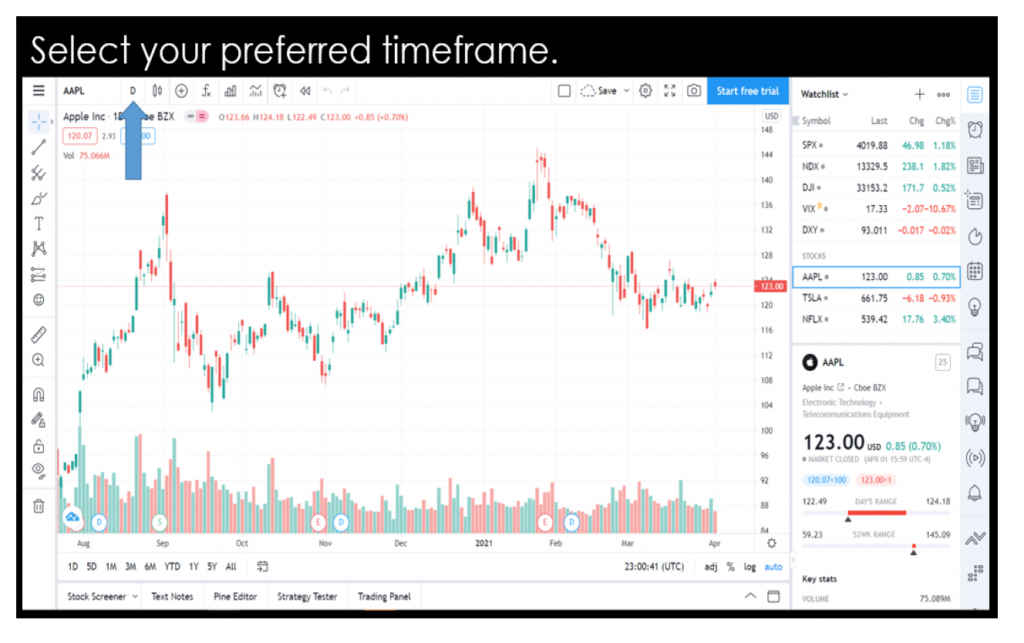
Then select your preferred timeframe. You could use a 5-minute, 15-minute, or 30-minute timeframe. It will always depend on your strategy, but for now, I didn’t change it. I stick to the one-day timeframe.
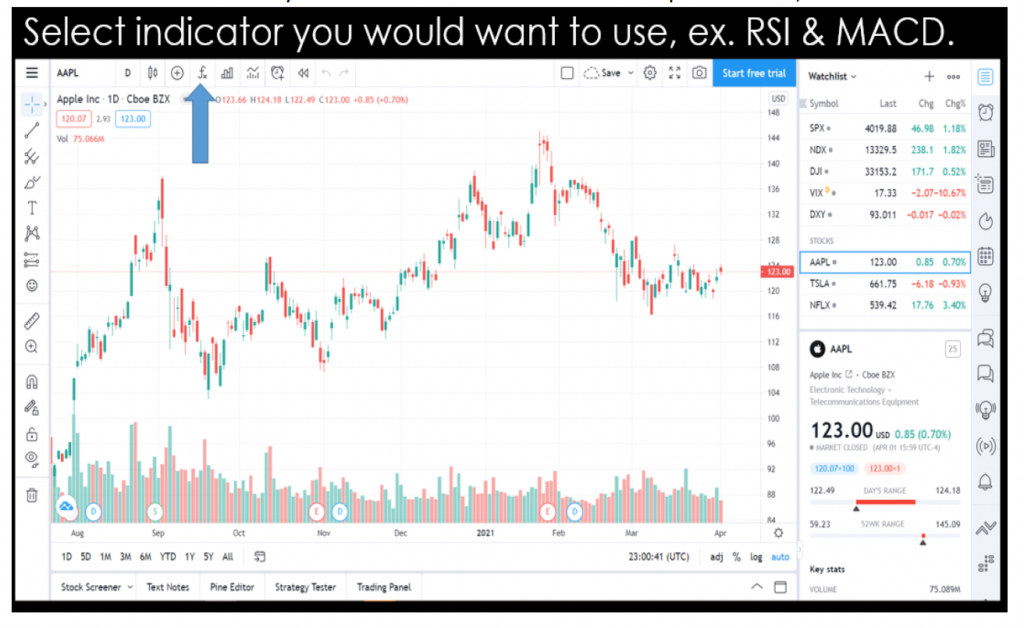
Then select the indicator you would want to use. For this sample exercise, I chose RSI and MACD.
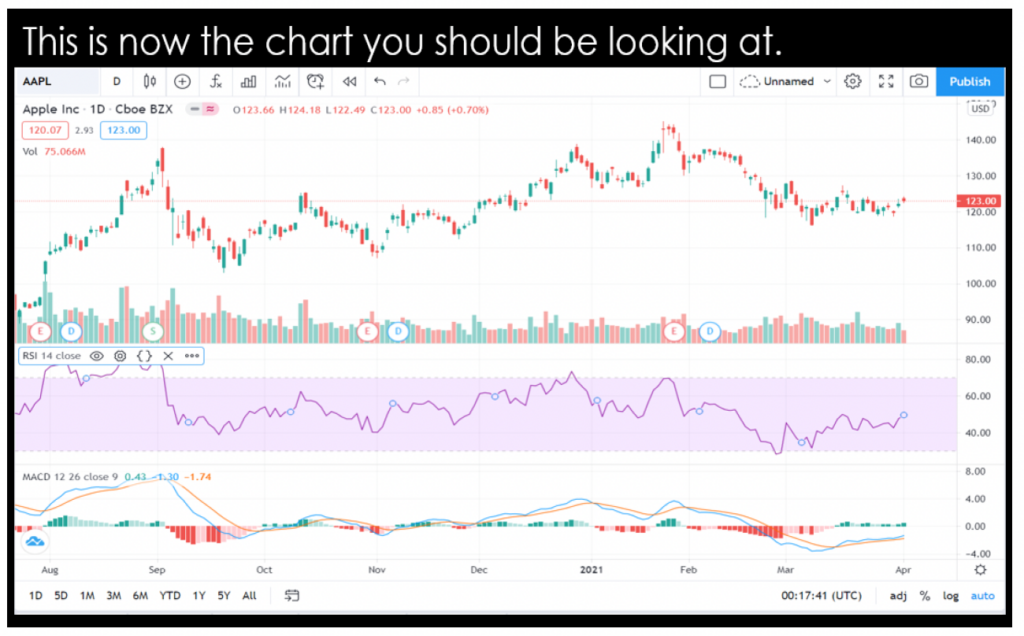
After being able to follow up on the instructions, this should now be what you will be seeing on your trading charts. If we both arrived at the same chart, then congratulations! You may now be able to continue analyzing on your own.
Want to learn more about cryptos? There’s a lot to learn. Learn cryptocurrency, blockchains, algorithmic trading, financial analysis, algorithmic trading, the stock market, and more in The Complete Python for Finance: Learn to Trade in 99 Days.