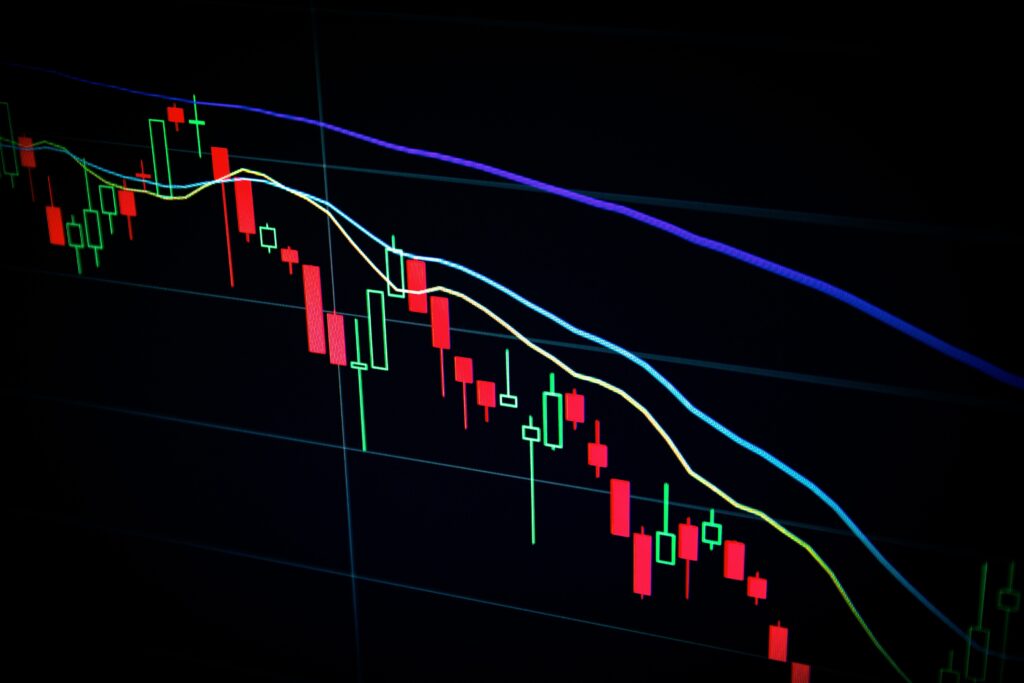
When you will be day trading, your decisions will be heavily influenced by technical analysis. You will be basing your strategies on the patterns and indicators you can see on your screen, so mastering and knowing which indicator to use on stocks is good preparation for the coming trading day. However, trading strategy changes with time and with the current events that contribute to the movement of the market so it is best that while you master the indicators, you also understand in parallel the market on a deeper level.
But before we delve into the indicators we could use, let us first know what are trading indicators, and why is it important to use them. Trading indicators, from the words themselves, indicate when you should do a trade. These are signals that help you know when to execute your purchase, and when to take your profits. It aims to show the trader the direction of the trend to determine the movement, the lack or existing momentum within the trading market, profit potentiality due to volatility, and determining the popularity through volume measurements.

There are also a lot of time frames that day traders could use but for day trading, the 5-10 minute charts will be your best friend. It is because the shorter the time frame, the quicker the trading setup will be shown in your chart. However, this is subjective. The timeframe that you use, and how you use it will depend on your trading strategy and your available time to trade.

As much as there are a lot of stocks that you could actually choose from, there are also a lot of trading indicators. They are roughly around 4,000 indicators but choose only a few that you could work around with. It is a common mistake for beginners to Building your trading screens and stuffing them with lots of indicators that will make you more confused, rather than confident in doing your trade. It will short circuit signal production because you are looking at the market from too many angles at once, and there’s too much noise to consider when there’s a lot that you are looking at.
For beginners, here are the recommended indicators that you can use.
1. Relative Strength Index (RSI)
Relative Strength Index, or RSI, was created by J. Welles Wilder Jr., who suggested that the momentum of an asset could be used as a prediction of a buying and selling opportunity. It is expressed as a single line with a figure ranging between 0 to 100. For the general rule of thumb – if an asset is around the 30 levels, it is considered as oversold; an asset around the 70 levels generally means that it is overbought. RSI is one of the best momentum indicators because it indicates market conditions and warning signals for dangerous price movements. It also tells when a crossover in the market trend has occurred.
Overbought signals may suggest to day traders that they should take profits and secure their gains before the stock price falls or corrects itself. In contrast, an oversold signal could mean that the stock is reaching maturity, and will enter a rally or consolidation before the stock price goes higher, or breakout.
2. Moving average convergence divergence (MACD)
Moving average convergence divergence, or MACD, is another intraday trading indicator that is most used by day traders, mainly because it shows the relationship between two moving averages of a stock price. Let us dissect first the words on this indicator. Moving averages look back at price actions over a specific period. ‘Convergence’ refers to two moving averages coming or meeting together, while ‘divergence’ means that they are moving away from each other. If moving averages are converging, it means the momentum of the stock is decreasing, whereas if the moving averages are diverging, momentum is increasing.
This indicator is very powerful for novice traders. It is because it provides information about the momentum of the market, trends, trend reversal, buy calls, and stop-loss points. It helps day traders examine rapid price change, and allows them to find out trading opportunities in the direction of the current market trend.
A general rule of thumb for this indicator is that when the MACD line crosses below the signal line, it signifies a bearish trend. A bullish trend is signaled when the MACD line crosses above the signal line.
3. Bollinger bands
Bollinger bands, on the other hand, indicate the volatility of the market. It provides a range within which the price of an asset is being typically traded by showing its bandwidth. The closer or narrower the bands are, the lower the expected or perceived volatility of the stock, or in other words, the market is quiet. The wider the band, the higher the stock price volatility or the market is having too much noise.
This indicator is useful for recognizing when an asset is trading outside its usual levels. As a general rule of thumb, when a price continually moves outside the parameters of the band, it signifies an overbought position. When it moves below the lower band, it means it is oversold
Want to learn more about cryptos? There’s a lot to learn. Learn cryptocurrency, blockchains, algorithmic trading, financial analysis, algorithmic trading, the stock market, and more in The Complete Python for Finance: Learn to Trade in 99 Days.

